about company
Overview
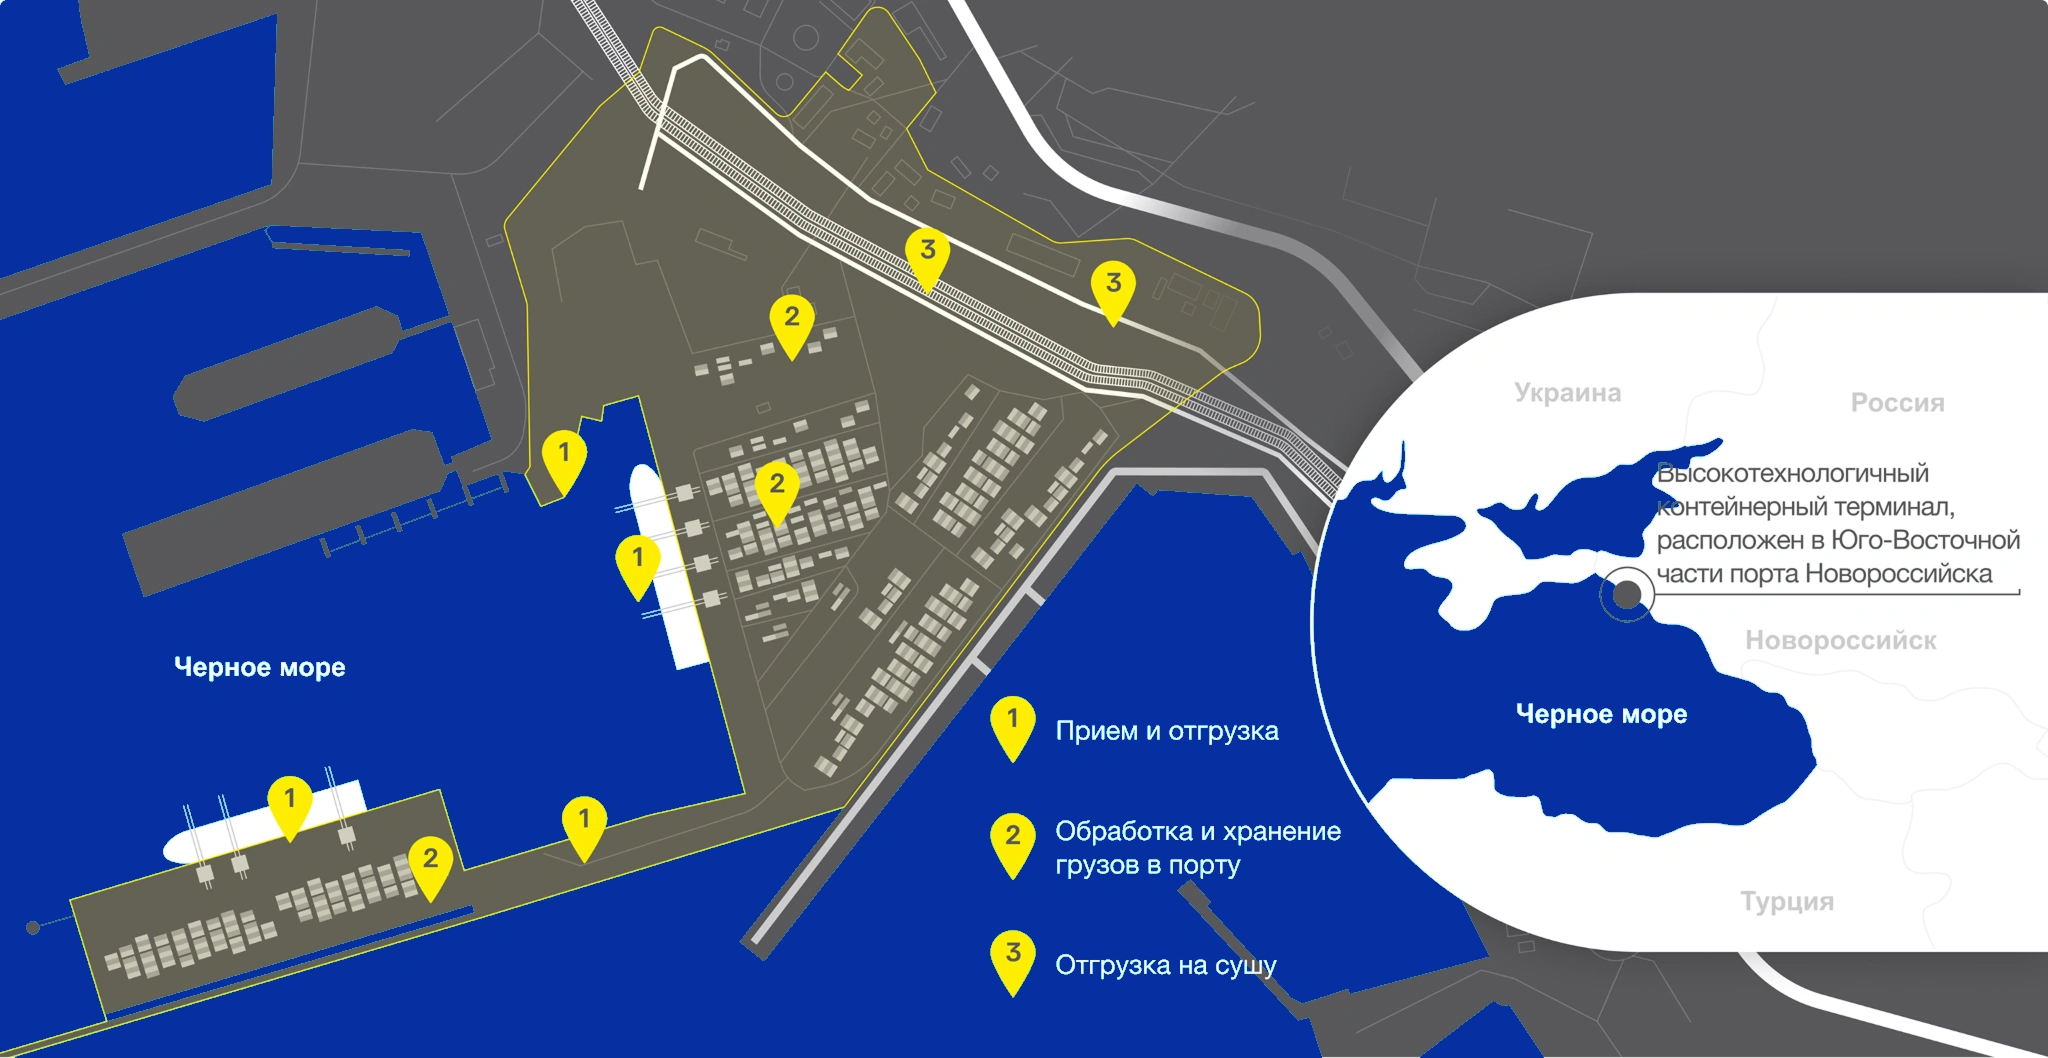
About NUTEP
Operating indicators
Financial performance
about company
Manual
Board of Directors
Management
about company
Infrastructure
and equipment
Mooring front
Railway Park
Auto-reception
Stock
about company
Investment projects
Completed projects
Infrastructure modernization
about company
Licenses and permits
Licenses
Permissions
For clients
Service center
Bank details
Division contacts
useful links
Documents
Press center
Media
Photo gallery
Video
Presentation
about company
Location
Sattelite
3D
Company
Review
History
Infrastructure and equipment
Investment projects
Licenses and permits
Сompliance with sanctions legislation policy
Map
Social
responsibility
Company policy
in the field of ecology, labor protection and safety
Charity
Terminal
Services
Clients
Handling dangerous goods
Accreditation
Service Center
Press Centre
News
Media
Contacts
Job
ru
en
ru
Review
About
About
About NUTEP
Operating indicators
About company
0
thous.
TEUs
bandwidth
terminal capacity
0
berths
and coastal and fortification
0
Ha
area
terminal
Receiving and shipping
to
0
thous.
TEUs
ocean-class vessels acceptance
containers
ro-ro cargo
general cargo
0
m
length
0
,
0
m
depth
0
m
length
of bank protection
0
,
0
m
depth
of bank protection
0
m
length
0
,
0
m
depth
0
m
length
0
m
depth
0
m
width
Filling / unloading
containers
Treatment
dangerous goods
Receiving and dispatching container trains
Handling and storage of cargo in the port
0
TEUs
container yard capacity
0
units
number of ref. sockets
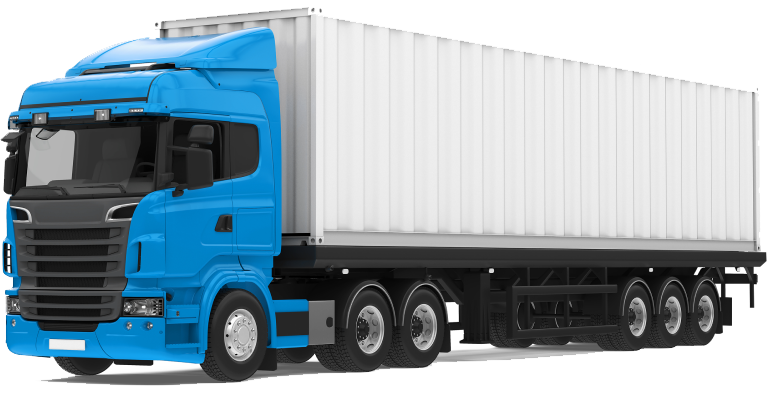
Shipment to land
car
reception
direct access to the federal highway M-4 "Don"
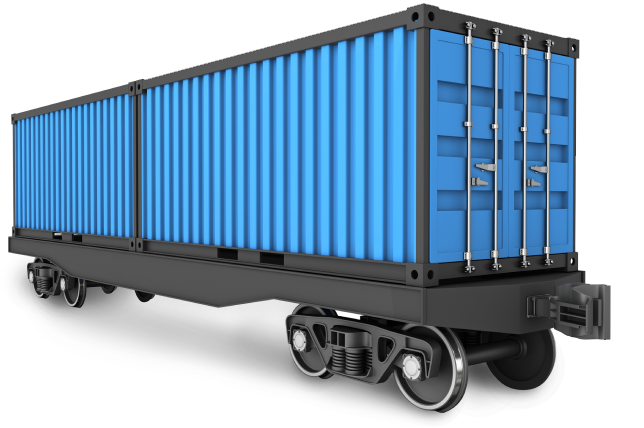
railroad reception
7-ti
worthwhile railway fleet, with minimum useful length
420 meters
2 branches
in the customs
and control zone for loading
and unloading containers
Freight turnover,
thous. tons
2020–2024 years
Containers
Ro-Ro
General cargo
2020 year
6 118
thousand tons
6 082
1
35
2021 year
6 982
thousand tons
6 904
1
78
2022 year
6 777
thousand tons
6 561
14
202
2023 year
7 109
thousand tons
6 873
74
162
2024 year
7 039
thousand tons
6 927
0
112
Container turnover,
thousand TEUs
2020–2024 years
2020 year
487
2021 year
546
2022 year
582
2023 year
603
2024 year
613
Our clients
ADMIRAL
MSC
ARKAS
LAM
HUB SHIPPING
SIDRA